In 1996, the Narragansett Bay Estuary Program conducted a Tier 1 survey for eelgrass and found only 100 acres remaining in Narragansett Bay. Today, there are about 1100 acres of eelgrass in all of Rhode Island’s coastal waters, a substantial increase since the 1996 survey. This increase is certainly good news; however, since we don’t have any comparative historical acreage numbers prior to 1996, it is difficult to assess the current acreage quantitatively. For example, the current acreage actually may be quite low compared to the acreage prior to the wasting disease of the 1930s. This is but one example why long-term and continuous monitoring is critical.
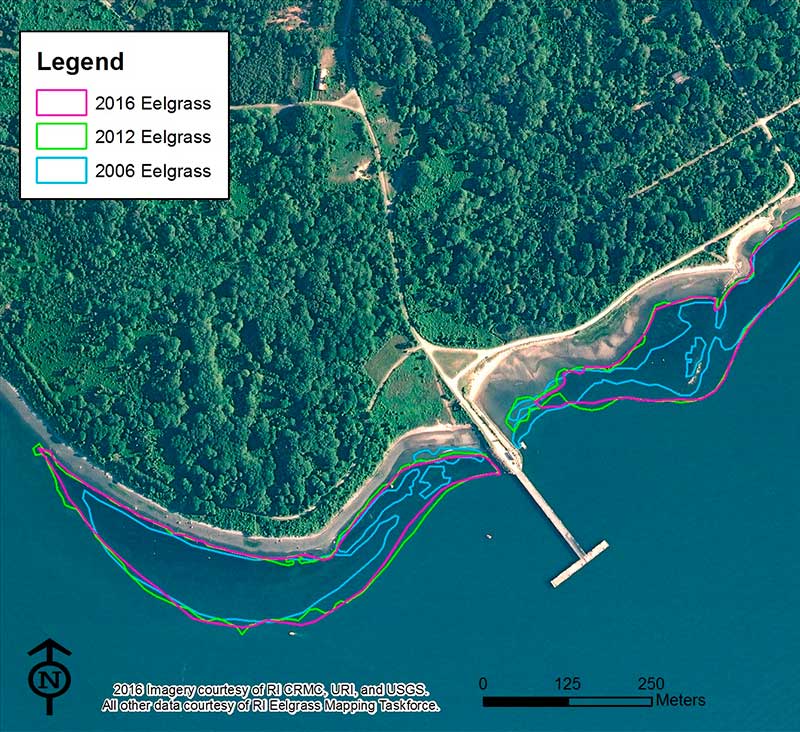
Over the past 10 years, there have been three Tier 1 surveys for eelgrass (2006, 2012, and 2016). Tier II and III surveys have also been conducted during this time frame. The Eelgrass Mapping Taskforce is currently analyzing all of the data from 2006-20016 and also processing the 2016 data. Preliminary 2016 findings suggest that there has been a steady decline in eelgrass in the coastal ponds, and the data suggest a slight decline since 2012 in Narragansett Bay as well. Tier III surveys at T-Wharf on Prudence Island also suggest a decline in total percent cover at that particular site. Interestingly, the Tier 1 surveys for T-Wharf suggest a general increase in eelgrass extent from 2006 to 2016 (Figure 1).
Eelgrass beds can be dynamic, expanding and contracting especially along the edges of the bed. This factor highlights the need for multiple levels of monitoring in order to accurately assess the trend of eelgrass over time.
Data
University of Rhode Island Environmental Data Center: Raw data for GIS, Web viewer
Climate Victim, Climate Cure
Eelgrass is simultaneously vulnerable to climate change and potentially a mitigation tool to combat it. Both warming water temperatures and rising sea levels negatively affect eelgrass. Narragansett Bay’s water temperature has increased 2°F in the last 30 years, reducing eelgrass seed production, killing plants, and increasing algae populations that shade and ultimately kill eelgrass. Rising sea levels result in existing eelgrass beds being submerged under deeper water, also reducing the amount of light available for photosynthesis.
On the plus side, eelgrass uses carbon dioxide in photosynthesis, removing it from the atmosphere and serving as a carbon sink. Through photosynthesis, eelgrass grows and the carbon dioxide that was once in the atmosphere is now trapped in the eelgrass blades, meaning that it no longer contributes to the greenhouse effect which causes global climate change When the eelgrass dies, the organic material, including the carbon, is trapped in the soil.
Methods now exist to account for the amount of carbon trapped by eelgrass beds—a useful tool for obtaining carbon credits in a carbon market (such as cap and trade) or simply for understanding the value of coastal ecosystems. This accounting process can be data intensive and complicated, but the process will improve as more restoration projects are performed and more information is collected. Additional monitoring and research will help managers better understand how eelgrass fits into our overall climate change adaptation strategy.